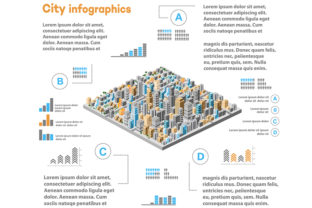
Urban Infographics: Visualizing the Modern Metropolis
In an era where data drives decision-making and visual storytelling captures attention, the way we represent complex city systems has undergone a profound transformation. Urban infographics have emerged as a critical tool for architects, urban planners, real estate developers, and digital marketers alike. These are not merely decorative charts; they are sophisticated visual languages that translate the chaotic rhythm of city life into clear, actionable insights. From tracking traffic flow to illustrating housing density, these visuals bridge the gap between raw statistics and human understanding.
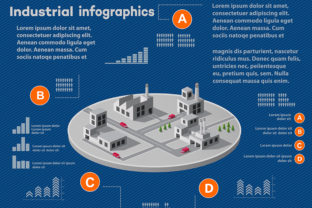
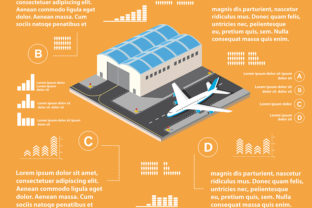
The evolution of this field is particularly evident in the rise of urban infographics with isometric city designs. This specific style moves beyond flat, two-dimensional representations, offering a three-dimensional perspective that feels tangible and immersive. By leveraging the principles of isometric projection, creators can depict buildings, infrastructure, and population metrics in a way that preserves spatial relationships while maintaining clarity. This approach resonates deeply with modern audiences who expect depth, context, and aesthetic appeal in the information they consume.
The Shift from Flat Data to Spatial Context
For decades, urban planning and market analysis relied heavily on traditional bar charts, pie graphs, and static maps. While effective for isolated data points, these formats often failed to convey the interconnected nature of urban environments. A simple line graph might show a spike in rental prices, but it cannot easily illustrate how that spike correlates with the construction of a new subway station or the zoning changes in a neighboring district. This is where the narrative power of urban infographics becomes indispensable.
Modern workflows demand a more holistic view. Professionals need to see how different variables interact within a physical space. The transition toward spatially aware visualization reflects a broader shift in user expectations. Today's stakeholders, whether they are investors analyzing a property portfolio or citizens concerned about local green spaces, want to visualize scenarios. They want to "see" the future of their neighborhood before it happens. This desire for spatial context has driven the adoption of techniques that mimic architectural blueprints but are optimized for digital consumption and public communication.
The integration of isometric city elements addresses this need by adding a layer of realism without the complexity of full 3D modeling. Unlike perspective drawings where parallel lines converge at a vanishing point, isometric projections keep all axes at 120-degree angles. This consistency allows designers to stack layers of information—such as transportation networks, utility grids, and demographic heatmaps—without distorting the underlying geometry. The result is a visual format that is both technically accurate and aesthetically engaging, making it easier for non-experts to grasp complex urban dynamics.
Why Isometric City Designs Are Gaining Traction
The popularity of urban infographics with isometric city aesthetics is not just a fleeting design trend; it is a response to the limitations of screen-based media. On mobile devices and digital dashboards, depth cues are essential for distinguishing between overlapping data sets. An isometric view provides immediate visual hierarchy. A skyscraper rendered in this style instantly communicates scale, while icons placed at its base can denote amenities, transit stops, or commercial zones.
This style also aligns with the current preference for clean, modular design systems. In the world of web development and app design, modularity allows for scalability. An isometric city infographic can be broken down into individual components—a single building block, a road segment, a park area—and reassembled to tell different stories. For example, a real estate firm might use the same asset library to create one infographic highlighting residential growth and another focusing on commercial expansion. This flexibility reduces production time and ensures brand consistency across various marketing materials.
Furthermore, the isometric style strikes a balance between abstraction and representation. It avoids the potential distraction of photorealistic imagery, which can sometimes obscure data, while offering more engagement than abstract geometric shapes. It invites the viewer to explore the scene, encouraging a longer dwell time on content. For educators and policymakers, this increased engagement translates to better retention of key messages regarding urban development, sustainability goals, or public safety initiatives.
Practical Applications Across Industries
The utility of these visual tools extends far beyond the realm of graphic design. They have become integral to the operational strategies of diverse sectors. In the technology sector, smart city initiatives rely on these infographics to communicate sensor data and IoT network coverage to municipal leaders. Instead of presenting rows of code or database entries, a visual map showing connectivity gaps in an isometric layout makes the problem immediately obvious and the solution clearer.
Real Estate and Development: Developers use these visuals to pitch projects to investors and secure community approval. An infographic showing a proposed mixed-use development, complete with renderings of the isometric city blocks and overlays of projected foot traffic, can be far more persuasive than a spreadsheet of financial projections. It helps stakeholders visualize the lifestyle and economic impact of the project.
Marketing and Branding: Digital agencies leverage urban themes to create relatable content for brands targeting metropolitan audiences. Whether it is a fintech company explaining peer-to-peer lending through a stylized city grid or a logistics firm demonstrating delivery routes, the urban setting provides a familiar backdrop that grounds abstract concepts in reality. The use of urban infographics with isometric city motifs signals innovation and forward-thinking, attributes that resonate with tech-savvy consumers.
Education and Public Policy: Educators use these tools to teach geography, sociology, and economics. Students can analyze population density, resource distribution, and historical growth patterns in a way that feels interactive and dynamic. Similarly, city councils use simplified versions of these graphics during town halls to explain budget allocations or infrastructure plans, ensuring that the information is accessible to residents of all backgrounds.
Adapting to Changing Workflows and Technologies
The creation of high-quality urban infographics has been democratized by advancements in software. Tools that once required specialized CAD skills are now accessible to general designers and marketers. Vector-based illustration programs and dedicated infographic platforms offer libraries of pre-made isometric assets, allowing users to drag and drop elements to build complex scenes quickly. This shift has lowered the barrier to entry, enabling smaller businesses and freelancers to produce professional-grade visualizations.
However, the ease of creation comes with the responsibility of accuracy. As these visuals become more common, the audience's ability to critique them also improves. Misleading scales, inaccurate proportions, or confusing color coding can undermine credibility. Therefore, professionals must prioritize data integrity alongside aesthetic appeal. The most effective infographics are those where the design serves the data, not the other way around.
Moreover, the integration of interactivity is the next logical step. Static images are powerful, but animated or clickable versions allow users to drill down into specific areas of interest. Imagine hovering over a district in an isometric city view to reveal detailed statistics about crime rates, school ratings, or average income. This level of engagement transforms passive viewing into active exploration, providing deeper value to the user.
Strategic Recommendations for Creators and Businesses
For those looking to incorporate urban infographics into their content strategy, several best practices stand out. First, define the core message clearly before beginning the design process. What is the single most important takeaway? Every element in the infographic should support this central idea. Cluttered visuals that attempt to tell too many stories at once will confuse the audience rather than inform them.
Second, consider the platform where the content will be consumed. An infographic designed for a large billboard may not translate well to a smartphone screen. Responsive design principles should be applied, ensuring that text remains legible and details do not get lost when the image is resized. Using scalable vector graphics (SVG) is often the best technical choice for maintaining quality across devices.
Third, embrace the unique advantages of the isometric perspective. Use verticality to show growth or density, and use depth to separate different layers of information. Color should be used strategically to guide the eye and highlight key data points, rather than simply for decoration. Consistency in style and iconography is crucial for maintaining a professional look.
Finally, remember that these visuals are part of a larger narrative. They should be accompanied by compelling copy that provides context and interpretation. An image can show the "what," but the accompanying text explains the "why" and the "how." Together, they form a cohesive story that educates, persuades, and inspires action.
As cities continue to grow and evolve, the need for clear, insightful, and visually engaging ways to understand them will only increase. Urban infographics with isometric city designs offer a robust framework for meeting this challenge. By combining the precision of data with the creativity of design, they empower individuals and organizations to navigate the complexities of the modern world with confidence and clarity. Whether you are planning a new development, launching a marketing campaign, or simply trying to understand your neighborhood, these tools provide a lens through which the urban experience becomes visible, understandable, and manageable.