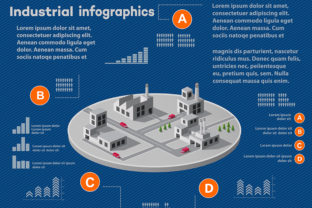
Industrial Infographics: Visualizing Complex Systems
In the realm of technical communication and data visualization, clarity is often the most valuable currency. Industrial infographics serve as a critical bridge between intricate engineering processes and the stakeholders who need to understand them. Unlike standard marketing graphics designed to evoke emotion or drive impulse purchases, these visual assets prioritize accuracy, spatial logic, and functional hierarchy. They transform dense specifications, operational workflows, and safety protocols into accessible, digestible formats that professionals can trust and utilize immediately.
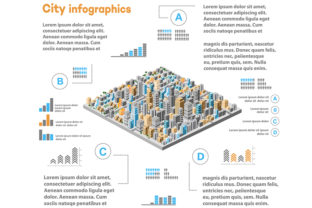
The evolution of this field has been significant. Early industrial diagrams were often flat, two-dimensional schematics that required specialized training to interpret. Today, the integration of modern design principles with technical precision has elevated the standard. The rise of isometric plant illustrations within this category represents a particularly powerful shift. By introducing depth and perspective without sacrificing orthographic accuracy, designers can now convey the three-dimensional reality of a facility on a two-dimensional screen or printed page. This approach allows viewers to grasp the physical relationships between machinery, piping, and structural elements instantly.
The Strategic Value of Isometric Plant Design
When evaluating the effectiveness of industrial infographics, one cannot overlook the specific utility of the isometric style. An isometric plant illustration maintains parallel lines for all three axes of an object, creating a 3D effect where vertical lines remain vertical, and horizontal lines are drawn at 30-degree angles. This technique offers a distinct advantage over traditional perspective drawings, which distort scale as objects recede into the distance.
For engineers, facility managers, and operations teams, this consistency is paramount. It allows for accurate measurement estimation and a clear understanding of equipment placement relative to one another. In a complex manufacturing environment, knowing exactly how a conveyor belt intersects with a storage silo or how ventilation ducts route around heavy machinery is not just about aesthetics; it is about operational efficiency and safety. The isometric plant style provides a "bird's-eye" view that feels tangible, enabling stakeholders to visualize maintenance access points, emergency egress routes, and workflow bottlenecks before a single bolt is tightened.
Furthermore, this style bridges the gap between technical documentation and executive reporting. A CEO or investor may lack the engineering background to read a detailed P&ID (Piping and Instrumentation Diagram), but they can easily comprehend an isometric overview of the production line. This versatility makes industrial infographics an essential tool for cross-departmental communication, ensuring that strategic decisions are grounded in a shared visual understanding of the physical infrastructure.
Key Characteristics of High-Quality Technical Visualization
Not all visuals created for the industrial sector hold equal weight. Effective industrial infographics share several defining characteristics that distinguish professional-grade assets from generic clip art. First and foremost is consistency. Every component, from valves to turbines, must adhere to a unified visual language. Inconsistent scaling or conflicting color codes can lead to dangerous misinterpretations in high-stakes environments.
- Precision and Accuracy: The geometry must reflect real-world dimensions and proportions. While artistic license exists in general design, industrial contexts demand fidelity to the source data.
- Hierarchical Clarity: Critical information must be prioritized through size, color, and placement. A warning sign or a primary control node should immediately draw the eye.
- Contextual Depth: Especially in isometric plant designs, the use of shading and occlusion helps define what is behind what, preventing confusion in crowded layouts.
- Scalability: These graphics must remain legible whether displayed on a massive control room monitor or printed on a small safety card for a field technician.
Another crucial element is the balance between detail and abstraction. Overloading a graphic with every single bolt and weld mark creates visual noise that obscures the main message. Conversely, oversimplifying can strip away necessary context. The best industrial infographics strike a middle ground, abstracting non-essential textures while retaining the geometric integrity of the components. This ensures the viewer focuses on the system's function rather than getting lost in unnecessary minutiae.
Real-World Applications and Performance
The practical value of industrial infographics extends across various stages of a project lifecycle. During the planning phase, they serve as powerful tools for stakeholder buy-in and site analysis. An isometric plant rendering can help architects and civil engineers identify potential clashes between new installations and existing structures, saving time and money during construction.
In the operational phase, these visuals become integral to training and safety compliance. Imagine a new employee orientation where a static manual is replaced by an interactive infographic showing the flow of materials through a processing plant. The retention rate for such visual learning is significantly higher. Workers can mentally rehearse procedures, understand the consequences of bypassing safety interlocks, and locate emergency shut-offs with greater speed.
Maintenance teams also benefit immensely. A well-crafted infographic can map out the logical sequence of disassembly for a complex unit, highlighting torque specifications and part numbers directly on the visual representation. This reduces downtime and minimizes the risk of human error during repairs. Furthermore, in the realm of sustainability and energy management, industrial infographics can visualize energy consumption patterns across different sections of a facility, helping managers pinpoint inefficiencies and implement targeted improvements.
Evaluating Usability and Long-Term Viability
When integrating industrial infographics into a business workflow, usability is the metric that determines long-term success. A graphic that looks impressive but is difficult to update or adapt will quickly become obsolete. Industrial facilities evolve; pipes are rerouted, machines are upgraded, and processes are optimized. Therefore, the underlying assets used to create these infographics must be modular and flexible.
Vector-based formats are generally preferred over raster images because they allow for infinite scalability and easy editing. If a piece of equipment changes model, a skilled designer can swap out a vector component without redrawing the entire scene. This flexibility ensures that the isometric plant visual remains a current reflection of the facility. Additionally, consider the medium of delivery. Will the infographic live on an internal intranet, be projected in a boardroom, or be printed as a large-format poster? The file structure and resolution must support these varied outputs without degradation.
Reliability is also tied to the source of the data. An infographic is only as good as the information it conveys. Regular audits of the visual content against actual site conditions are necessary to maintain trust. If a worker notices a discrepancy between the diagram and the physical plant, confidence in all subsequent documentation may erode. Thus, a robust process for updating industrial infographics is just as important as their initial creation.
Who Benefits Most from This Approach?
The audience for industrial infographics is diverse, spanning from technical specialists to corporate leadership. Engineers and Architects rely on them for design validation and clash detection. Operations Managers use them for workflow optimization and capacity planning. Safety Officers leverage them for hazard identification and emergency response training.
However, the benefits extend beyond the immediate technical team. Investors and Clients gain a clearer picture of asset value and operational maturity when presented with polished, comprehensive visualizations. Marketing Teams in the B2B industrial sector can use these assets to demonstrate capability and technological sophistication in proposals and case studies. Even educational institutions teaching vocational trades find that isometric plant diagrams provide students with a realistic preview of the environments they will enter upon graduation.
For freelancers and agencies specializing in technical illustration, mastering this niche offers a distinct competitive advantage. The barrier to entry is higher than in general graphic design, requiring a blend of artistic skill and technical literacy. Those who can deliver accurate, aesthetically pleasing industrial infographics command premium rates and secure long-term partnerships with firms that recognize the strategic value of clear communication.
Practical Considerations and Limitations
While the advantages are substantial, there are limitations to acknowledge. Creating high-quality industrial infographics, particularly those featuring detailed isometric plant views, requires significant upfront investment in terms of time and expertise. It is not a task suitable for quick-turnaround templates unless the facility is extremely simple. Accurate modeling demands access to precise CAD drawings, blueprints, and site surveys. Without this foundational data, the resulting graphic risks being misleading.
Additionally, there is a risk of over-reliance on visualization. An infographic is a representation, not a substitute for detailed engineering calculations or official safety manuals. It should always be accompanied by appropriate disclaimers and linked to authoritative documentation. Finally, the complexity of the visual can sometimes overwhelm less experienced viewers. It is the responsibility of the creator to guide the audience through the graphic using annotations, callouts, and logical sequencing to ensure the message is received clearly.
Ultimately, industrial infographics represent a convergence of art and engineering. When executed with precision and purpose, they do more than decorate a report; they illuminate complex systems, enhance safety, and drive informed decision-making. For any organization operating in the industrial sector, investing in these visual tools is an investment in clarity, efficiency, and operational excellence. As technology advances, the ability to render increasingly sophisticated isometric plant models will only grow in importance, making this a vital competency for the future of industrial communication.