Isometric Infographics of the City: A Visual Toolkit for Modern Storytelling
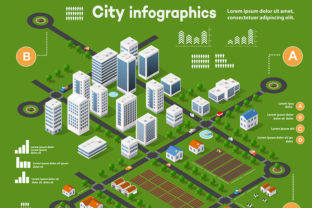
When you need to explain a complex urban environment without overwhelming your audience, isometric infographics of the city offer a distinct visual language that bridges the gap between technical blueprints and engaging storytelling. Unlike flat 2D maps or hyper-realistic 3D renders, this style uses a specific angle where vertical lines remain vertical while horizontal lines recede at 30-degree angles. The result is a clean, three-dimensional perspective that feels tangible yet stylized, allowing viewers to understand spatial relationships instantly.
This aesthetic has moved beyond architectural drafts into the mainstream of digital design. Whether you are a marketer trying to visualize a logistics network or an educator explaining urban planning, these graphics provide a structured way to present data. They strip away the visual noise of real-world photography, focusing the viewer's attention on the information you want to convey. The charm lies in their ability to make dense information feel organized and accessible.
The Unique Appeal of Isometric Urban Design
Why do so many professionals gravitate toward this specific style? The answer lies in clarity and scalability. In a world saturated with high-definition imagery, sometimes less is more. Isometric infographics of the city allow designers to pack a significant amount of detail into a single frame without creating clutter. You can see inside buildings, show traffic flow, and highlight infrastructure all at once.
Consider the cognitive load on a reader. When they look at a photograph of a busy downtown, they process textures, lighting, shadows, and random pedestrians. When they look at an isometric illustration, they process structure, function, and hierarchy. This makes the format ideal for scenarios where the "how" and "where" matter more than the aesthetic beauty of the location itself. It turns a chaotic cityscape into a legible diagram.
Real-World Applications Across Industries
The versatility of this visual style means it serves a wide range of users, from small business owners to large enterprise teams. Here is how different groups leverage these assets in practical situations.
For Entrepreneurs and Startup Founders
If you are pitching a new delivery service, a ride-sharing app, or a smart-city solution, investors need to grasp your operational model quickly. A static slide deck often fails to communicate the scope of a network. By integrating isometric infographics of the city, you can visually map out your service area. Imagine showing a simplified city block where your delivery drones navigate between rooftops, or where your electric scooters dock at specific terminals. This visual proof of concept builds confidence far faster than bullet points alone.
For example, a fintech startup might use a city infographic to illustrate how peer-to-peer payments ripple through a neighborhood. The visual metaphor of money moving through streets and buildings makes an abstract financial concept concrete and relatable for non-technical stakeholders.
For Marketers and Content Creators
In the crowded space of social media and blog content, standing out requires immediate visual engagement. Bloggers covering urban lifestyle trends or travel guides often struggle to find stock photos that don't look generic. Custom or curated isometric assets solve this. A travel blogger writing about airport efficiency can use an isometric infographic of the city airport to break down the passenger journey from check-in to boarding.
Marketers running campaigns for real estate developments also benefit immensely. Instead of showing a render of a single building, they can place that building within a vibrant, stylized neighborhood context. This helps potential buyers visualize not just the property, but the lifestyle surrounding it—proximity to parks, transit hubs, and commercial centers—all rendered in a cohesive, friendly style.
For Educators and Presenters
Teachers and corporate trainers face the challenge of simplifying complex systems. When teaching urban geography, civil engineering, or logistics management, diagrams are essential. An isometric view allows students to see the layers of a city: the underground subway tunnels, the street-level traffic, and the air traffic above. This layered approach is particularly effective when discussing sustainability projects or construction phases.
Imagine a lesson on public transportation. An instructor can use a graphic showing a terminal connected to various districts, highlighting transfer points and capacity. This visual aid transforms a dry lecture on transit networks into an interactive exploration of how a city functions as a living organism.
Focusing on Airports and Aviation Logistics
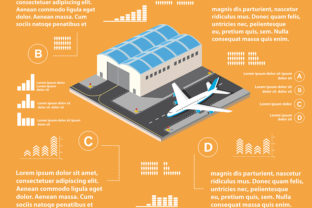
A specific subset of this trend involves detailed representations of aviation hubs. The isometric infographics of the city airport have become a staple for airlines, travel agencies, and tourism boards. These visuals go beyond simple floor plans; they capture the dynamic energy of travel.
These graphics often feature key elements like terminals, runways, baggage claim areas, and planes in various states of motion. For instance, a "flight of construction and building" theme might be used to show the expansion of a terminal wing, illustrating the timeline of development without needing a series of boring Gantt charts. Instead, you see the old terminal next to the new construction, with cranes and materials clearly marked.
Travel agencies use these images to explain layover procedures or airport amenities. A graphic showing a plane taxiing to a gate, passengers disembarking, and moving through security creates a narrative flow that reduces traveler anxiety. It sets expectations before the trip even begins. Furthermore, for businesses involved in cargo logistics, these infographics can visualize supply chains, showing how goods move from the tarmac to warehouses and then to city distribution centers.
Choosing the Right Assets for Your Needs
While the benefits are clear, selecting the right resources requires careful consideration. Not every isometric asset will fit your brand voice or project requirements. Before downloading or commissioning custom work, evaluate the following factors.
- Complexity vs. Clarity: Ensure the level of detail matches your message. If you are explaining a simple route, a highly detailed city with hundreds of windows and cars might distract rather than inform. Look for assets that balance richness with readability.
- Customization Potential: Can you change colors to match your brand guidelines? Do the layers separate easily if you need to isolate a specific building or vehicle? High-quality vector files or well-organized PSDs are crucial for professional adaptation.
- Cultural Relevance: Architecture varies globally. An infographic featuring New York-style skyscrapers might not resonate with an audience in a European city with historic low-rise buildings. Choose assets that reflect the actual environment you are depicting to maintain authenticity.
- Licensing and Usage Rights: Always verify the license terms. Some free resources restrict commercial use, while others require attribution. For business applications, investing in a premium license ensures you avoid legal complications down the line.
Maximizing Impact Through Context
The true power of isometric infographics of the city emerges when they are integrated thoughtfully into a larger narrative. They should not just sit on a page as decoration; they must serve a functional purpose. Use them to highlight data points, trace user journeys, or compare scenarios.
For instance, if you are presenting a "before and after" scenario for a city renovation project, use two side-by-side isometric views. One shows the congested, outdated infrastructure, and the other reveals the streamlined, modern solution. This direct visual comparison drives home the value of your proposal more effectively than statistics alone.
Similarly, when discussing the "flight of construction," animate these graphics if possible. Even simple CSS animations or GIFs showing a plane taking off or a crane lifting a beam add a layer of dynamism that captures attention in digital presentations. The movement reinforces the idea of progress and activity inherent in urban development.
Ultimately, whether you are a freelancer looking to elevate your portfolio, a small business owner mapping out your logistics, or an educator making complex topics digestible, these visual tools offer a robust solution. They transform the abstract complexity of urban life into something understandable, engaging, and actionable. By choosing the right isometric assets and applying them with strategic intent, you can turn data into stories that resonate deeply with your audience.