Isometric Three-dimensional Infographics Explained
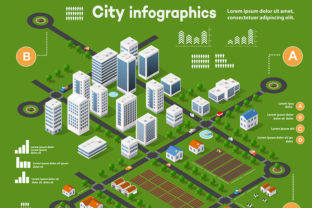
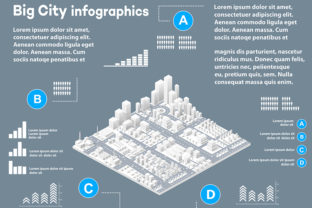
Imagine a cityscape that doesn't just sit on your screen but invites you to step inside it. This is the power of Isometric Three-dimensional Infographics. Unlike flat, two-dimensional charts that often feel sterile or abstract, these visuals construct a tangible world where data lives alongside architecture. When you see a 3D city isometric three-dimensional infographic complete with skyscrapers, cozy homes, and bustling stores, you aren't just reading numbers; you are navigating a narrative. The streets wind through blocks of data, trees provide visual breathing room, and business conceptual graphs rise like landmarks against the skyline. For designers, entrepreneurs, and marketers, this style transforms dry statistics into an engaging journey that audiences actually want to explore.
The Visual Personality of Isometric Design
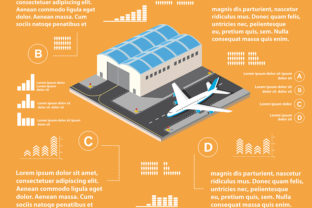
At its core, the appeal of Isometric Three-dimensional Infographics lies in its unique perspective. By using parallel projection rather than linear perspective, these graphics eliminate vanishing points, ensuring that lines remain parallel and scale stays consistent throughout the image. This creates a distinct, almost toy-like aesthetic that feels both modern and timeless. The visual characteristics are immediately recognizable: clean geometric angles, a 30-degree rotation on the horizontal axis, and a sense of depth that never distorts.
This style possesses a personality that is simultaneously playful and professional. It avoids the rigidity of traditional corporate charts while maintaining enough structure to convey complex information clearly. The inclusion of elements like skyscrapers representing market growth, homes symbolizing residential investment, and stores indicating retail foot traffic allows for immediate visual association. When combined with business conceptual graphs and diagrams integrated directly into the environment—perhaps a bar chart forming the silhouette of a building or a pie chart acting as a town square—the result is a cohesive visual language. It bridges the gap between modern typography principles and spatial design, creating a brand identity that stands out in a sea of generic slides.
Where Isometric Graphics Shine Across Industries
The versatility of Isometric Three-dimensional Infographics makes them a powerful tool across a wide spectrum of creative and commercial projects. In web design, they serve as captivating hero images that reduce bounce rates by hooking visitors instantly. A landing page featuring a 3D city isometric three-dimensional infographic can explain a service ecosystem better than paragraphs of text ever could. For social media graphics, the intricate details of streets, trees, and buildings encourage users to pause and zoom in, increasing dwell time and engagement.
In the realm of editorial design and publishing, these infographics break up dense articles, providing visual anchors that guide the reader's eye. Magazines and digital publications use them to illustrate economic trends, urban planning concepts, or technological infrastructure. Packaging design also benefits from this style, particularly for tech products or lifestyle brands that want to project innovation and complexity. A box featuring a miniature isometric city suggests a product that is part of a larger, interconnected system.
Furthermore, for logo design and branding, the geometric precision of isometric art offers a fresh alternative to standard icons. While a full city might be too detailed for a small favicon, simplified isometric elements can become memorable brand marks. Whether used in commercial font presentations, pitch decks for startups, or internal reports for established corporations, the ability to visualize data within a constructed environment adds a layer of sophistication that flat designs simply cannot match.
Impact on Readability and Brand Perception
One of the most critical aspects of any visual communication is how it influences readability and audience perception. Isometric Three-dimensional Infographics excel at establishing a clear visual hierarchy. By placing key data points in prominent structures like tall skyscrapers or central plazas, designers can guide the viewer's attention exactly where it needs to go. This spatial organization helps the brain process information more efficiently, turning abstract concepts into concrete realities.
The consistency of the isometric grid ensures that every element—from the smallest tree to the largest business conceptual graph—feels part of a unified whole. This cohesion reinforces professionalism and builds trust. When a brand presents information in such a structured, thoughtful manner, it signals competence and attention to detail. Conversely, poorly executed 3D attempts can look cluttered or confusing. The difference lies in the balance between decorative elements (like the texture of the streets or the foliage of the trees) and functional data visualization.
Audience engagement skyrockets when viewers feel they are exploring a world rather than consuming content. The "miniature" effect triggers curiosity. People naturally want to scan the scene, looking for hidden details or connections between the homes and the stores. This active viewing process leads to better retention of the message. For content creators and bloggers, this means their insights are not just read but remembered. The style elevates the perceived value of the content, making a simple report feel like a premium asset.
Practical Guidance for Implementation
Choosing to incorporate Isometric Three-dimensional Infographics into your workflow requires careful consideration. First, evaluate the fit for your specific project. If your data is highly complex and requires precise numerical comparison, a traditional table or line graph might still be superior. However, if your goal is storytelling, trend illustration, or showcasing relationships between different sectors, the isometric city approach is ideal.
When selecting design assets, look for high-quality vector files that allow for scalability without loss of resolution. Many premium font libraries now offer complementary icon sets that match the isometric angle, ensuring your labels and titles align perfectly with the 3D elements. Testing font pairing is crucial here; a sans serif font often works best to maintain the clean, modern look, while a display font might add character to headlines. Avoid overly ornate script fonts or handwritten fonts unless they are used sparingly for emphasis, as they can clash with the geometric rigidity of the isometric grid.
Always review the included styles and variations before committing. Ensure the color palette supports the depth of the 3D elements; shadows and highlights are essential for selling the illusion of volume. Finally, pay close attention to commercial licensing. Since these graphics are often used in client-facing materials, verify that you have the rights to modify and distribute them. Whether you are a hobbyist crafting a personal project or a small business owner launching a new campaign, respecting intellectual property ensures your work remains professional and legally sound.
By embracing the depth and narrative potential of Isometric Three-dimensional Infographics, you transform data into a destination. You create a space where skyscrapers tell stories of growth, streets map out strategies, and trees soften the hard edges of business logic. It is a style that respects the intelligence of the audience while delighting their senses, proving that even the most complex information can be beautiful.