Circle Infographics: Transforming Complex Data into Visual Stories
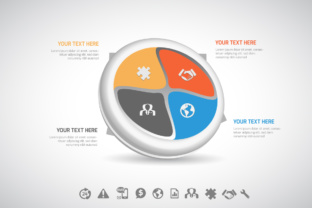
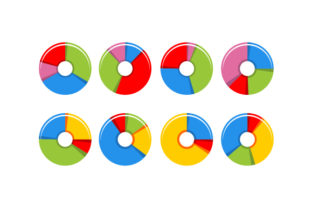
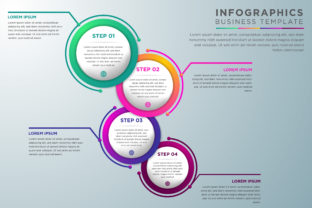
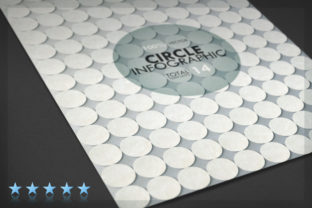
In the crowded landscape of digital communication, the ability to convey information quickly and memorably is a superpower. This is where Circle Infographics step in, offering a unique geometric approach to visual storytelling. Unlike traditional linear layouts that can feel rigid or overwhelming, circle-based designs leverage the human brain's natural affinity for symmetry and central focus. The specific "Circle infographic" set you are considering isn't just a collection of shapes; it is a comprehensive toolkit containing 14 distinct templates crafted entirely from circular elements. These templates range from dynamic process flows to precise pie charts, bar charts, and area charts, all designed to turn raw data into compelling narratives.
The Power of Circular Design in Professional Contexts
Why choose circles? In design psychology, the circle represents unity, wholeness, and continuity. When you present data within this shape, you subtly guide the viewer to see connections rather than isolated facts. For professionals aged 20 to 50 who need to pitch ideas, report on performance, or explain complex systems, this format reduces cognitive load. Instead of scanning left-to-right through dense paragraphs, the eye naturally gravitates toward the center of the circle and radiates outward, following the flow of information.
The versatility of this specific set lies in its ability to adapt to various industries without losing its structural integrity. Whether you are a marketing manager needing to visualize a campaign funnel or a project coordinator mapping out a timeline, the circular motif provides a cohesive visual language. It allows you to break away from the standard slide deck aesthetic, making your presentation stand out in boardrooms and client meetings alike.
Real-World Scenarios: Where Circle Infographics Shine
Imagine you are leading a quarterly review for a tech startup. You have metrics on user acquisition, retention rates, and churn. A standard table might get lost in the spreadsheet, but using one of the process templates from the Circle Infographics set, you can create a radial chart where each stage of the customer journey is a segment of the circle. This instantly shows the relationship between stages and highlights bottlenecks visually. The high-quality options included in the pack ensure that even when projected on a large screen, the gradients and meshes remain crisp and professional.
Consider another scenario: a healthcare organization explaining a new patient care pathway to staff. Linear diagrams can sometimes make a process seem endless. By utilizing the circular layout, you emphasize the cyclical nature of patient care—assessment, treatment, recovery, and follow-up. The "Live text" feature in the AI files makes it incredibly easy to swap out medical terminology for your specific protocols without hiring a graphic designer. You can update the content as guidelines change, ensuring your internal communications stay current with minimal effort.
For educators and trainers, these templates offer a fresh way to present curriculum structures or learning outcomes. An area chart built from circles can show the distribution of time spent on different modules, while a pie chart template can illustrate demographic data of student enrollment. The fact that the set includes 100 vector shapes means you aren't limited to the base templates; you can mix and match elements to create custom diagrams that perfectly fit your lesson plan.
Unlocking Flexibility Across Industries
The true strength of the Circle Infographics set is its cross-industry applicability. In finance, precision is key. The inclusion of editable EPS10 and CS files ensures that financial data remains accurate and scalable. You can zoom in on a specific sector of a pie chart to highlight a percentage point difference without pixelation, thanks to the vector nature of the graphics. This is crucial for annual reports where stakeholders demand clarity and professionalism.
In the creative sectors, such as advertising or web design, the aesthetic appeal takes precedence. The templates contain gradients and meshes that add depth and texture, moving beyond flat, boring colors. If you are designing a website landing page, the JPG images at 300dpi provide immediate high-resolution assets that load well and look stunning. However, if you need to tweak the color scheme to match a brand guideline, the layered PSD files allow you to adjust individual elements, ensuring brand consistency across all touchpoints.
Non-profit organizations often struggle to communicate their impact stories effectively. With 14 fully layered templates, a non-profit can take donor statistics and transform them into an emotional journey. A circular process diagram can show how a donation travels from the donor to the final beneficiary, creating a sense of transparency and trust. The ease of customization means that even volunteers with basic design skills can produce publication-ready materials.
Technical Considerations for Maximum Editability
While the visual potential is immense, understanding the technical requirements is essential for a smooth workflow. The set is generated in Adobe Illustrator CC, which offers the highest level of control. To reach maximum editability, it is recommended to use Adobe Illustrator for the primary editing process. The files come with "Live text," meaning you can click and type directly into the shapes to change labels, titles, and data points. This saves hours of work compared to raster-based images where text must be recreated manually.
If you are working within the Photoshop ecosystem, the 14 layered PSD files are a valuable asset. They retain the structure of the original design, allowing you to manipulate layers, masks, and effects. However, keep in mind that some advanced features specific to Illustrator, such as certain mesh gradients or live effects, may not translate perfectly into PSD format. For users who need to share editable source files with clients or collaborators, the EPS10 and AI formats are industry standards that ensure compatibility across different versions of vector software.
One practical consideration is the font usage. Since the templates rely on specific typography to maintain their balance, having access to the correct fonts is important. If you don't have the exact fonts installed, the system will substitute them, which might alter the layout slightly. It is always a good practice to check the help file included with the download for details on the fonts used. This small step ensures that your final output looks exactly as intended, preserving the professional polish of the original design.
Balancing Strengths and Limitations
The Circle Infographics set excels in scenarios requiring visual engagement and conceptual clarity. Its strengths lie in its scalability, the richness of the vector shapes, and the variety of chart types available. The ability to start with a pre-organized, fully layered structure means you spend less time building from scratch and more time refining your message. The inclusion of both high-res JPGs and editable vector files covers almost every delivery requirement, from print brochures to social media posts.
However, there are limitations to consider. While circles are excellent for showing relationships and cycles, they may not be the best choice for displaying long lists of sequential data or very granular numerical comparisons. In cases where you need to show a strict chronological timeline with many steps, a linear format might still be superior. Additionally, because the designs rely heavily on the circular motif, overusing them in a single document can become visually repetitive. The key is to select the right template for the specific story you are telling, rather than forcing every piece of data into a circle.
Ultimately, the decision to use this tool depends on your goal. If your objective is to capture attention, simplify complexity, and present data in a modern, aesthetically pleasing way, the Circle Infographics set provides a robust solution. By leveraging the 14 templates and the extensive library of vector shapes, you can elevate your presentations, reports, and marketing materials, turning abstract numbers into clear, actionable insights that resonate with your audience.