3 Isometric Infographic Arrows: A Modern Visual Tool for Engaging Presentations
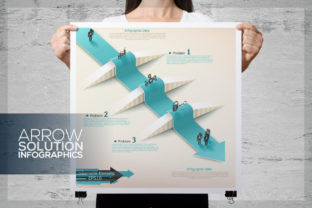
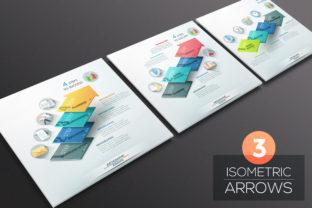
Visual communication plays a critical role in how information is absorbed, especially in professional, educational, and digital contexts. The 3 Isometric Infographic Arrows pack offers a creative and technically robust solution for designers seeking to enhance workflow diagrams, web layouts, and data-driven presentations. This resource includes three distinct isometric arrow designs, each segmented into four vibrant sections, allowing for a dynamic visual narrative. Whether used for explaining processes, illustrating directional flow, or showcasing multi-step concepts, these arrows provide both aesthetic appeal and functional flexibility.
Understanding the Core Features
At its heart, the 3 Isometric Infographic Arrows package is designed for versatility and ease of use. Each arrow is rendered in a 3D isometric style, giving depth and modernity to otherwise flat layouts. The division into four color-coded segments enables users to represent distinct phases, categories, or transitions within a single visual element. The inclusion of 20 flat icons further expands the toolkit, allowing for seamless integration into dashboards, infographics, and interface designs.
The resource is delivered in multiple formats—EPS, AI, JPG, and PSD—ensuring compatibility across design platforms. Adobe Illustrator users benefit from "Live text" functionality, making textual edits straightforward without compromising quality. For those requiring high-resolution outputs, the 300dpi JPG and layered PSD files offer print-ready clarity. The organization of vector shapes and layers ensures that even complex edits remain manageable, especially when working at scale or integrating into larger visual systems.
Comparing Isometric Infographics to Other Visual Formats
Isometric visuals have gained popularity for their ability to convey three-dimensional space without the complexity of full perspective drawing. Compared to traditional flat icons or linear flowcharts, isometric graphics like the 3 Isometric Infographic Arrows offer a more immersive and visually engaging way to represent processes and directional relationships.
- Flat Design: While flat icons are minimalist and clean, they often lack the spatial depth needed to illustrate layered or sequential actions. Isometric arrows, by contrast, create a sense of movement and hierarchy within a single image.
- Linear Infographics: Standard linear diagrams work well for straightforward sequences but may feel static or rigid. The 3D nature of isometric arrows introduces a sense of motion and interactivity, which can be particularly useful in digital interfaces or animated presentations.
- Photorealistic Graphics: Though visually rich, photorealistic images can be difficult to edit and may not align with modern design trends that favor scalability and simplicity. Vector-based isometric illustrations like those in the 3 Isometric Infographic Arrows pack maintain clarity at any size and are easy to customize.
Strengths and Limitations
The 3 Isometric Infographic Arrows pack shines in scenarios where visual clarity and adaptability are key. Its vector-based format ensures scalability without loss of quality, making it suitable for both web and print applications. The layered PSD files and AI compatibility allow for deep customization, enabling designers to tailor colors, labels, and layout elements to match brand guidelines or project requirements.
However, as with any design resource, there are tradeoffs to consider. Users unfamiliar with Adobe Illustrator may find the AI and EPS files less accessible, especially if they lack experience working with vector graphics. Additionally, while the isometric style is visually compelling, it may not be appropriate for all content types—particularly in cases where a more formal or minimalist tone is required.
Best Use Cases for 3 Isometric Infographic Arrows
Designers and content creators will find the 3 Isometric Infographic Arrows particularly effective in the following scenarios:
- Business Presentations: Use the arrows to illustrate strategic pathways, project timelines, or organizational transitions. Their segmented structure allows for clear labeling of each stage.
- Website Infographics: Incorporate the arrows into landing pages or explainer sections to guide users through a service offering, product lifecycle, or conversion funnel.
- Mobile and Web UI Design: The included flat icons and layered files make these arrows ideal for dashboard elements, progress indicators, or onboarding sequences.
- Educational Materials: Teachers and instructional designers can use the arrows to break down complex processes into digestible visual segments, particularly in digital learning environments.
For projects that require a balance between visual impact and editorial clarity, the 3 Isometric Infographic Arrows offer a strong foundation. However, for more abstract or conceptual narratives—such as those requiring symbolic or metaphorical representation—other visual tools like flowcharts, mind maps, or abstract icon sets may be more suitable.
Decision Factors: When to Choose This Resource
Deciding whether to incorporate the 3 Isometric Infographic Arrows into a design project depends on several factors:
- Design Style: If your project leans toward modern, tech-forward, or user-centric visuals, the isometric approach will likely resonate well.
- Editing Needs: Those with access to Adobe Illustrator or similar vector editing tools will get the most out of this pack, especially when customizing text, colors, and layout layers.
- Use Case: If your goal is to depict step-by-step processes, directional flow, or segmented data, these arrows provide a clear and engaging format.
- Delivery Format: With both vector and raster formats included, this resource is well-suited for multi-platform use, from web banners to printed reports.
Conversely, if your project requires a more traditional or minimal aesthetic, or if you're working with limited design tools, you may find other infographic styles or simpler icon sets more practical.
Alternatives and Complementary Resources
While the 3 Isometric Infographic Arrows offer a distinctive approach, they are part of a broader ecosystem of visual storytelling tools. Depending on the project, you may consider combining them with:
- Flat Process Diagrams: For simpler, two-dimensional explanations that pair well with isometric elements in mixed-style layouts.
- Animated Infographics: To bring movement and interactivity to presentations, especially in digital formats where engagement is key.
- Custom Vector Illustrations: For a fully branded visual identity, commissioning original illustrations that align with your messaging can elevate the overall design.
Ultimately, the best approach depends on the message you want to convey, the audience you're addressing, and the platforms you're using. The 3 Isometric Infographic Arrows serve as a valuable asset in a designer's toolkit, particularly when clarity, structure, and visual appeal are top priorities.