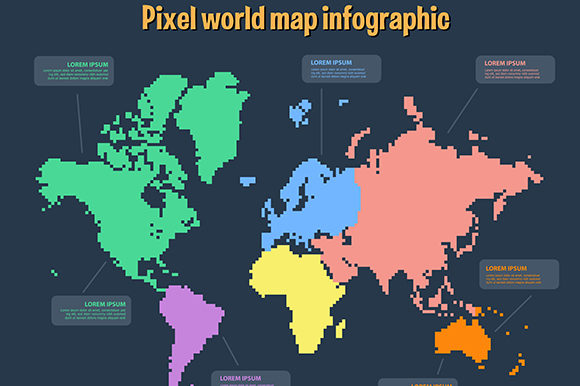
The Power of Vector World Maps: A Comprehensive Guide to Design, Use, and Benefits
What Is a Vector World Map?
A vector world map is a digital representation of the Earth's surface created using vector graphics. Unlike raster images, which are made up of pixels, vector maps use mathematical equations to define shapes, lines, and colors. This means they can be scaled infinitely without losing quality, making them ideal for everything from large wall posters to detailed infographics.
Vector world maps are commonly used in design, business presentations, educational materials, and digital platforms where clarity and adaptability are essential. Whether you're creating a travel brochure, a business report, or a classroom handout, a vector world map provides a clean, professional foundation.
Scalability Without Quality Loss
One of the most significant advantages of using a vector world map illustration is its scalability. Whether you're designing a small infographic or a massive billboard, the map remains crisp and clear. This flexibility is crucial for designers who need to repurpose content across different formats and sizes.
Customization and Flexibility
Vector maps can be easily edited using software like Adobe Illustrator or free tools like Inkscape. You can change colors, add icons, highlight specific regions, or overlay data points to suit your needs. This level of customization makes vector world maps an essential tool for infographics design templates.
Integration with Data Visualization
In the world of business, education, and media, data is king. Vector world maps serve as excellent backdrops for visualizing global data—such as population distribution, trade routes, or climate change impacts. Their clarity ensures that the message is communicated effectively without visual clutter.
Business and Marketing
Companies with international operations often use vector world maps to showcase their global reach. These maps can illustrate regional sales performance, market penetration, or customer distribution. By integrating a vector world map illustration, businesses can present complex data in an easy-to-understand format.
Education and Learning
Teachers and educators use vector world maps to help students understand geography, history, and global issues. Unlike static images, vector maps can be annotated, colored, or layered with information to create interactive learning experiences. They are also commonly used in textbooks, presentations, and online courses.
Travel and Tourism
Vector world maps are widely used in the travel industry to highlight destinations, plan itineraries, and visualize travel routes. Travel agencies and bloggers often use them to create visually appealing guides and promotional materials that engage potential travelers.
Non-Profit and Government Use
Non-profit organizations and government agencies use vector world maps to illustrate humanitarian efforts, disaster relief zones, or public health campaigns. These maps help communicate the scope and impact of their work to donors, stakeholders, and the general public.
Consider Your Purpose
Before selecting a vector world map infographics design template, it's important to consider your end goal. Are you creating a map for a presentation, a website, or a printed poster? Each medium may require different formatting, color schemes, and levels of detail.
Look for Editable Layers
High-quality vector maps often come with separate layers for countries, oceans, borders, and labels. This allows for more precise editing and customization. Make sure the template you choose supports layer manipulation to maximize flexibility.
Check Licensing and Usage Rights
Always verify the licensing terms for any vector world map you use. Some templates are free for personal use but require a license for commercial projects. Others may restrict modification or redistribution. Understanding these terms ensures you avoid legal issues down the line.
Start with a Clear Message
Every infographic should have a clear purpose. Whether you're showing global trends, comparing data, or highlighting a specific region, your vector world map should support that message rather than distract from it.
Use Color Strategically
Color plays a crucial role in conveying information. Use contrasting colors to highlight key areas, and stick to a consistent palette that aligns with your brand or topic. Avoid using too many colors, which can confuse the viewer.
Incorporate Icons and Labels
Icons and labels can help identify locations, data points, or trends. For example, you might use a plane icon to represent travel routes or a dollar sign to show economic activity. These visual cues make your infographic more engaging and easier to understand.
Keep It Simple and Readable
While it's tempting to include as much data as possible, simplicity is key. Focus on the most important information and ensure that your map doesn't become overcrowded. A clean, uncluttered design ensures your audience can quickly grasp the main points.
Vector Maps Are Only for Designers
While vector world maps are commonly used by graphic designers, they are accessible to anyone with basic design software. Many templates are user-friendly and require minimal technical skills to customize.
They Can’t Show Detailed Geography
Some people believe that vector maps lack the detail of satellite or topographic maps. While it's true that vector maps are simplified, they can be enhanced with additional layers and annotations to show elevation, terrain types, or other geographic features.
All Vector Maps Are the Same
Vector world maps vary widely in style, detail, and complexity. Some are minimalist and modern, while others are highly detailed and stylized. Choosing the right one depends on your project's needs and audience.
How to Find High-Quality Vector World Map Templates
- Adobe Stock – Offers a wide range of royalty-free vector maps for commercial and personal use.
- Freepik – A popular resource with both free and premium vector world map templates.
- Flaticon – Great for finding vector icons and maps that can be integrated into infographics.
- OpenStreetMap – An open-source platform that allows users to download and modify vector maps.
- Canva – Provides drag-and-drop templates that include vector world maps for quick and easy design.
Presentations and Reports
Whether you're presenting to a board of directors or submitting a school report, including a vector world map can elevate your visuals. It adds a professional touch and helps your audience grasp spatial relationships quickly.
Website and App Development
Many websites and mobile apps use vector world maps to display global data or user locations. Because they load quickly and scale well, vector maps are ideal for responsive web design and interactive dashboards.
Social Media and Marketing Materials
From Instagram posts to email newsletters, vector world maps can make your content stand out. They are especially useful for campaigns that target international audiences or promote global initiatives.
Conclusion: The Versatility of Vector World Maps
From business analytics to educational tools, vector world maps are a powerful asset in today’s digital landscape. Their scalability, customization options, and compatibility with data visualization make them indispensable for designers, educators, marketers, and analysts alike.
By choosing the right vector world map illustration and leveraging vector world map infographics design templates, you can create compelling visuals that inform, engage, and inspire. Whether you're a beginner or a seasoned professional, understanding how to use these tools effectively will enhance your work and help you communicate your message with clarity and impact.