Infographic Icon: A Practical Guide for Digital Creators
In the landscape of digital communication, clarity and speed are paramount. An infographic icon serves as a fundamental building block in this ecosystem, acting as a visual shorthand that conveys complex data or concepts instantly. These graphic elements are distinct from generic clip art; they are specifically designed to integrate seamlessly into larger visual narratives, such as charts, diagrams, and step-by-step guides. For designers, marketers, and content creators, understanding the utility, limitations, and strategic application of these icons is essential for producing effective digital assets.
Defining the Infographic Icon
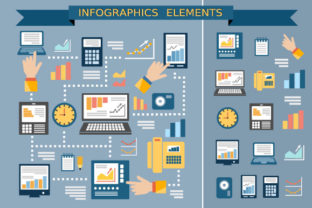
An infographic icon is a simplified, stylized graphic symbol used to represent specific ideas, categories, or data points within a larger visual composition. Unlike detailed illustrations, these icons prioritize recognition and scalability. They are typically created as vector graphics, meaning they are composed of mathematical paths rather than pixels. This technical characteristic ensures that an infographic vector icon remains crisp and clear whether it is displayed on a small mobile screen or projected onto a large conference hall display.
The design language of these icons often leans towards minimalism. By stripping away unnecessary details, the focus shifts to the core concept the icon represents. This abstraction allows them to function universally across different cultures and contexts, provided the symbolism is widely understood. Whether representing "growth," "security," "connectivity," or "sustainability," the goal is immediate cognitive processing by the viewer.
Why Evaluate Infographic Icons?
Professionals turn to infographic icons when faced with the challenge of presenting dense information without overwhelming the audience. The primary motivation is often the need to break up walls of text and create visual anchors that guide the reader's eye through a narrative. In an era of short attention spans, these icons serve as critical engagement tools.
Furthermore, consistency is a major driver for their adoption. When a project requires multiple visual elements—such as a series of blog posts, a corporate annual report, or a multi-page presentation—using a cohesive set of icons ensures a unified brand identity. Designers evaluate these assets not just for their individual aesthetic appeal, but for how well they harmonize with existing typography, color palettes, and layout structures.
Benefits and Strategic Advantages
The advantages of utilizing high-quality infographic icons are multifaceted. First and foremost is scalability. Because they are vector-based, they can be resized infinitely without loss of quality. This flexibility is crucial for responsive web design, where the same asset must render correctly on various device resolutions.
Efficiency is another significant benefit. Creating custom illustrations for every data point is time-consuming and expensive. Using a library of pre-designed infographic icons accelerates the production workflow, allowing teams to focus on strategy and storytelling rather than drawing individual symbols from scratch.
Additionally, these icons enhance accessibility. When paired with proper alt-text descriptions, they provide visual cues that aid comprehension for users who may struggle with long-form text. They act as universal signposts, helping users navigate complex information architectures more intuitively.
Tradeoffs and Considerations
Despite their utility, there are tradeoffs to consider. One common pitfall is visual homogeneity. Many free or low-cost icon sets share similar design languages, which can lead to generic-looking projects that lack a unique brand voice. If a designer relies too heavily on stock assets without customization, the final output may feel impersonal or indistinguishable from competitors' work.
Another consideration is contextual ambiguity. While simplicity is a strength, it can sometimes result in vague representations. An icon intended to represent "innovation" might look identical to one meant for "technology" if the design is too abstract. This requires careful selection and, occasionally, the addition of labels to ensure the message is not misinterpreted.
Licensing is also a critical factor. Not all infographic icons are free to use for commercial purposes. Some require attribution, while others have restrictions on the number of end products or the types of media in which they can appear. Failing to verify licensing terms can lead to legal complications and reputational damage.
Situations Where Infographic Icons Excel
There are specific scenarios where infographic icons are the optimal choice. They are particularly strong fits for:
- Data Visualization: In dashboards and reports, icons help categorize metrics (e.g., using a dollar sign for revenue, a user silhouette for customer count), making trends easier to spot at a glance.
- User Interface (UI) Design: Navigation menus, action buttons, and status indicators rely on standardized icons to reduce cognitive load for software users.
- Process Flows: Step-by-step guides benefit from sequential icons that visually map out a journey, from onboarding to completion.
- Mobile Applications: Given the limited screen real estate on mobile devices, compact icons convey functionality more effectively than text labels alone.
In these contexts, the balance between visual weight and informational density is perfect. The icon does not distract; it clarifies.
When to Consider Alternatives
While versatile, infographic icons are not a universal solution. There are situations where alternative visual strategies may yield better results.
If a project requires conveying emotional nuance or complex human interaction, simple icons may fall short. In cases where storytelling demands empathy or character development, detailed illustrations or photography are superior choices. An icon cannot capture the subtlety of a facial expression or the texture of a physical environment.
Furthermore, if the subject matter is highly technical or niche, standard icon libraries may lack the specificity required. For example, representing a specialized medical procedure or a unique engineering component might necessitate a custom diagram or a detailed schematic rather than a generic symbol. In these instances, the risk of misinterpretation outweighs the benefits of simplicity.
Finally, for brands that prioritize a highly distinctive, hand-drawn, or artistic aesthetic, stock infographic icons might clash with the overall tone. Custom illustration becomes necessary to maintain the integrity of a unique visual identity.
Practical Decision-Making Insights
To determine whether an infographic icon aligns with your goals, apply a structured evaluation process. Begin by defining the primary objective of the visual element. Is it to label, decorate, or explain? If the goal is explanation, test the icon with a sample audience to ensure the meaning is clear without accompanying text.
Next, assess consistency requirements. If you are integrating new icons into an existing system, check for compatibility in stroke width, corner radius, and fill style. Mismatched styles can disrupt the visual flow and make a professional project appear amateurish.
Consider the technical constraints of your delivery platform. Ensure the file format (SVG, PNG, EPS) supports your needs regarding interactivity, animation, and resolution. Vector formats are generally preferred for their versatility, but raster formats may be necessary for specific print applications or legacy systems.
Lastly, review the licensing terms thoroughly. Verify that the usage rights cover your intended scope, including geographic distribution and duration of use. Investing time in due diligence now prevents costly issues later.
Conclusion
The infographic icon is a powerful tool in the digital creator's arsenal, offering efficiency, scalability, and clarity. However, its effectiveness depends on thoughtful selection and appropriate application. By weighing the benefits against potential tradeoffs and considering the specific context of the project, professionals can decide when to leverage these assets and when to seek alternatives. Ultimately, the goal is not merely to add graphics, but to enhance communication. When used strategically, infographic icons transform complex data into accessible insights, driving better engagement and understanding across a wide range of digital creative projects.